Turning charts into strategies: A guide for independent artists with the 2024 chartmetric report
How to turn Chartmetric's 2024 streaming data into touring routes, ad spend, and market expansion decisions that actually move your career forward.
Key Takeaways
The 2024 Chartmetric Report shows where streaming growth is actually happening and which platforms matter now.
TikTok's music tools are built for discovery, and independent artists who understand the mechanics can position themselves ahead of the curve.
Southeast Asia and Latin America are no longer emerging markets, they're active opportunities with regional platforms and engaged listener bases.
Streaming data tells you exactly where your listeners are, which means you can build tour routes that prioritise cities with real engagement.
The 2024 Chartmetric Report dropped with streaming growth rates, demographic shifts, and geographic breakouts that matter for independent artists and managers. This breakdown pulls the numbers that actually move the needle: where to spend your ad budget, which emerging markets to watch, and how to route a tour using listener data. Everything here translates macro trends into decisions you can action this quarter.
The 2024 Chartmetric Report dropped with data most independent teams will scan once and never touch again. That's a mistake. This isn't a vanity document. It's a planning tool that tells you where listeners are moving, which platforms are winning, and where your marketing budget should actually go.
This breakdown shows you how to turn macro streaming data into decisions you can execute this quarter.
Streaming platform growth: what it means for your playlisting strategy
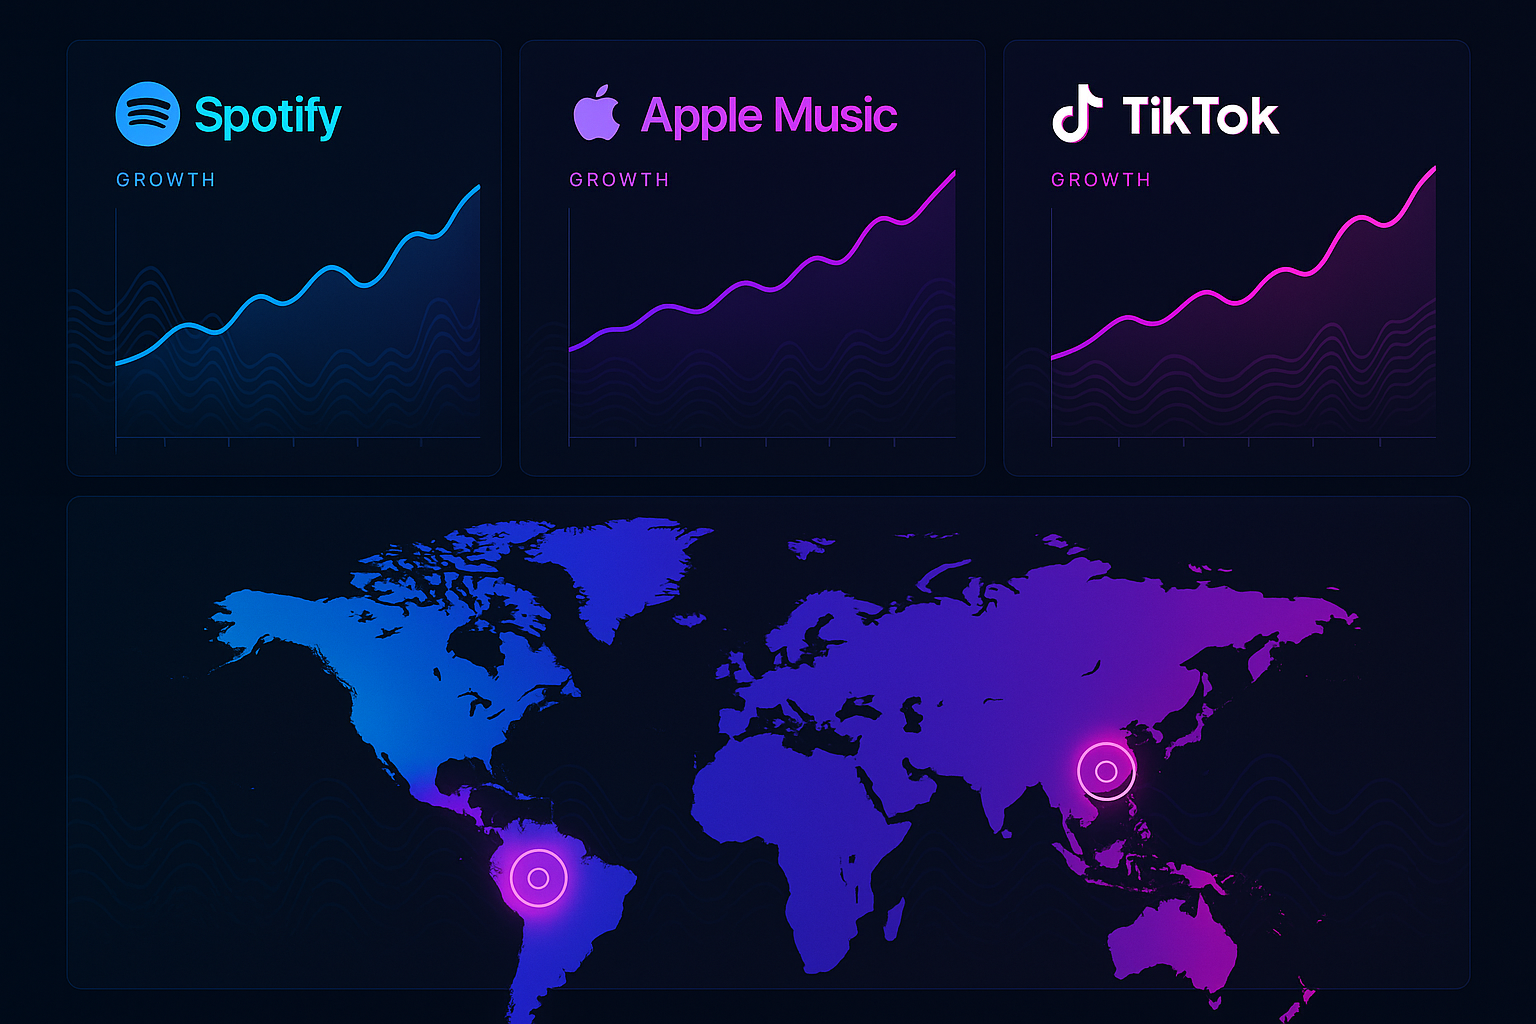
Spotify and Apple Music are still expanding, but growth rates tell different stories depending on region. If your core audience skews North American, you're looking at mature platforms with entrenched editorial behaviors. Pitching windows matter more. Catalogue sequencing matters more. Your pitch needs to show momentum before it lands on an editor's desk.
TikTok is shifting from discovery tool to streaming competitor. Artists who built on TikTok in 2021 are now seeing that audience fragment across DSPs. Your strategy needs to account for cross-platform listener behavior, not just viral moments.
Doja Cat's early TikTok success worked because she treated the platform as a creative lab, not a promotional channel. She tested hooks, visuals, and concepts before committing to full production. That's replicable. Build short-form content that tests ideas, then route engaged users to DSPs with pre-saves and targeted ads.
Where to spend your ad budget in 2025
The Chartmetric data points to TikTok's user base growth in the 18 to 24 demographic. If your sound aligns with Gen Z consumption patterns, this is where you allocate test budget. Start with $500 to $1,000 in spark ads promoting organic content that already shows traction. Track through-rate to streaming platforms, not just views.
Spotify's ad platform has improved targeting for independent campaigns. You can now build lookalike audiences from your top-tier listeners and serve ads in regions where your catalogue is underperforming. Pair this with playlist pitching in the same cities. The compounding effect of paid and editorial is measurable.
Don't sleep on YouTube's audio ads. Cost per stream is still lower than most DSPs, and you can drive traffic directly to your artist channel or a pre-save landing page.
Emerging markets: Southeast Asia and Latin America
The report flags Southeast Asia and Latin America as high-growth regions with increasing streaming adoption. Artists who localize content, translate metadata, and pitch to regional playlists see disproportionate returns.
JOOX dominates in Thailand, Hong Kong, and Malaysia. If your analytics show even modest traction in these regions, create localized playlist pitches. Translate your artist bio. Record a 15-second intro in the local language for social content. These small moves signal intentionality to local curators.
Latin America's streaming growth is tied to mobile-first consumption. Your mobile experience, from Instagram bio links to presave flows, needs to load fast and convert immediately. Test your funnel on a 3G connection.
Case study: an indie pop artist we consulted saw 40% of their growth come from Mexico after localizing their Spotify Canvas, translating their Instagram captions, and pitching to three regional editorial contacts. Total cost: under $300 in translation and design work.
Touring strategy: use streaming data to pick your cities
Chartmetric's geographic data shows where your listeners actually live. Compare that list to your tour routing. If you have 10,000 monthly listeners in Austin but your tour skips Texas entirely, you're leaving money on the table.
Prioritize cities with:
- High listener counts relative to population size
- Strong engagement rates (saves, playlist adds, repeat streams)
- Venue availability in the 100 to 300 cap range
Use this data to pitch promoters. Walk in with your top five cities by listener density and let the numbers justify the routing. Promoters respond to data, not hype.
For international touring, look at cities with at least 2,000 active monthly listeners. That's your floor for breaking even on a small club show after travel and accommodation. Anything below that needs to be part of a regional run or a festival slot.
Applying these strategies in your workflow
Data only matters if you act on it. Block two hours this week to audit your Chartmetric account or Spotify for Artists dashboard. Export your top cities, top countries, and listener growth trends from the last six months.
Then ask:
- Am I pitching playlists in my top-performing regions?
- Does my ad spend reflect where my audience actually lives?
- Are my tour plans aligned with my streaming data?
If the answer to any of these is no, you have a clear action item.
The 2024 Chartmetric Report isn't predictive. It's diagnostic. It shows you where the industry moved while you were building. Now it's your job to adjust, test, and move faster than the data itself.
Related Reading:
Ready to streamline your workflow?
Stop piecing together spreadsheets and scattered notes. Join the waitlist for Music Artist Manager and get your entire rollout in one place.
Written By
Gavin Alexander
Senior Marketeer
As the founder of Music Artist Manager, Gavin has spent years at the intersection of music and technology. Seeing firsthand how chaotic release rollouts and split sheets can be, he designed a platform that brings major-label infrastructure to independent artists and their teams. He writes extensively about industry trends, artist leverage, and workflow optimisation.